Be yourself; Everyone else is already taken.
— Oscar Wilde.
This is the first post on my new blog. I’m just getting this new blog going, so stay tuned for more. Subscribe below to get notified when I post new updates.
Be yourself; Everyone else is already taken.
— Oscar Wilde.
This is the first post on my new blog. I’m just getting this new blog going, so stay tuned for more. Subscribe below to get notified when I post new updates.
Whenever a query is run for the first time in SQL Server, it is compiled and a query plan is generated for the query. Every query requires a query plan before it is actually executed. This query plan is stored in SQL Server query plan cache. This way when that query is run again, SQL Server doesn’t need to create another query plan; rather it uses the cached query plan which improved database performance
Whenever a query is run for the first time in SQL Server, it is compiled and a query plan is generated for the query. Every query requires a query plan before it is actually executed. This query plan is stored in SQL Server query plan cache. This way when that query is run again, SQL Server doesn’t need to create another query plan; rather it uses the cached query plan which improved database performance.
The duration that a query plan stays in the plan cache depends upon how often a query is executed. Query plans that are used more often, stay in the query plan cache for longer durations, and vice-versa.
How to view the SQL Server query plan cache
SQL Server provides the following dynamic management views and functions that can be used to find out what is in the plan cache at any given time.
Let us use these functions and views to see what is in the SQL Server cached query plan. Execute the following query on your SSMS (SQL Server Management Studio):
SELECT cplan.usecounts, cplan.objtype, qtext.text, qplan.query_plan FROM sys.dm_exec_cached_plans AS cplanCROSS APPLY sys.dm_exec_sql_text(plan_handle) AS qtextCROSS APPLY sys.dm_exec_query_plan(plan_handle) AS qplanORDER BY cplan.usecounts DESC
Clearing the plan cache
To clear the plan cache
DBCC FREEPROCCACHE
A microservice is a largely independent application component tasked with a specific function in a system.
This type of setup has many advantages, such as the ability to write any service in a different technology and deploy them independently as well as performance boost and more. But it also comes with quite a few challenges, including complex administration and configuration.
learning about microservices design patterns is a great way to understand microservices better – more high-level than actual coding, yet specific enough to figure out the inner workings of microservices.
Types of microservices design patterns based on the communication patterns
The direct pattern
API Gateway
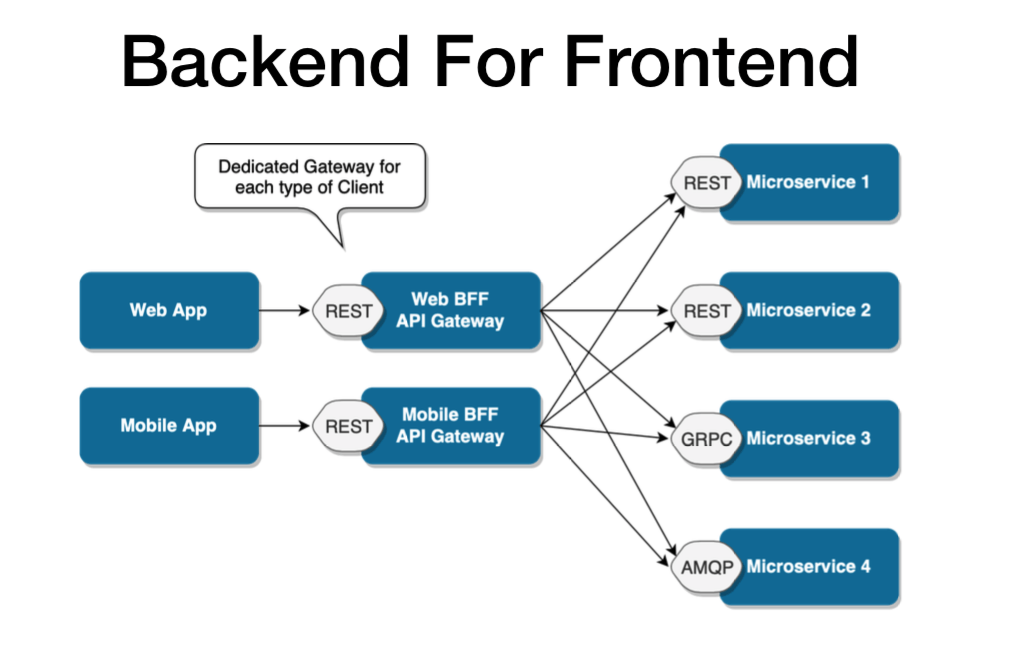
Backend For Frontend (BFF).
This is the most basic setup for a microservices-based architecture. In this design pattern, a client app makes requests directly to microservices, as shown in the picture below. Each microservice has a public endpoint (URL) the client can communicate with.
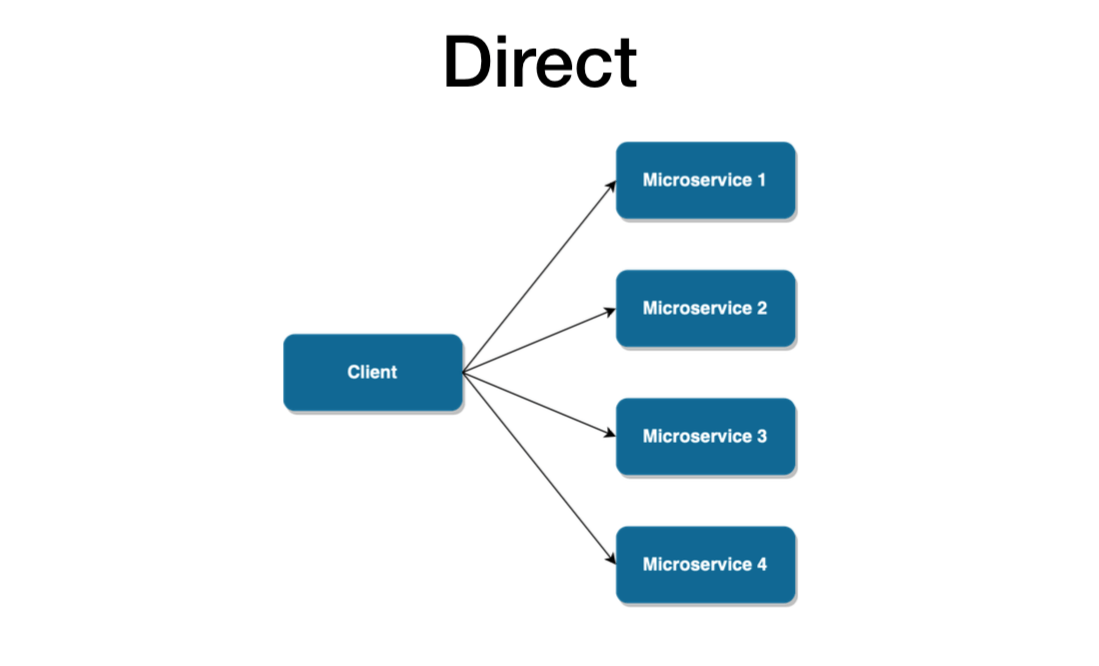
In this we have Performance,Scalability,Security and complexity issues.
Since microservices are usually recommended for complex apps, there must be more scalable patterns with greater business capability and the ability to easily support multiple services.
The API Gateway takes the business capability up a level. As described in the picture below, it provides an extra layer, a single entry point between a group of microservices and the frontend layer. This design pattern addresses all the concerns we just mentioned, by hiding the endpoint of microservices from the public, abstracting references to microservices from the client and reducing latency by aggregating multiple calls.
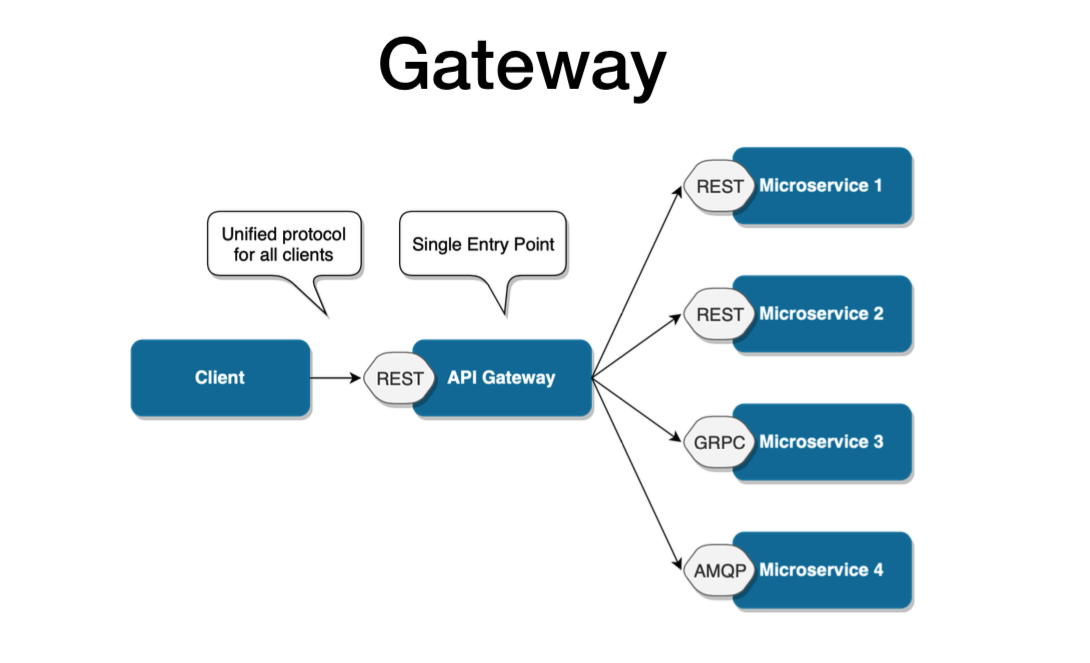
However, this microservice design pattern is still not safe from scalability issues. It’s more than sufficient when the architecture revolves around one client. But if there are multiple client apps, the API Gateway design pattern may eventually get bloated, having absorbed all the varying requirements from different client apps. Eventually, it may practically become a monolithic app and face a lot of the same issues experienced with the direct pattern.
Therefore, if you plan for your microservices-based system to have multiple clients or distinct business domains, you should rather consider using the Backend for Frontend design pattern from the start.
BFF is essentially a variant of the API Gateway pattern. It also provides an additional layer between microservices and clients. But rather than a single point of entry, it introduces multiple gateways for each client.
With BFF, you can add an API tailored to the needs of each client, removing a lot of the bloat caused by keeping it all in one place. The result pattern can be seen in the picture below.
It’s worth it to mention that this particular pattern may still be extended for particularly complex apps. Different gateways can also be created for particular business domains. This model is flexible enough to respond to just about any type of microservices-based situation. It’s perfect for continuous delivery of microservice architecture on a really large scale and provides incredible business capabilities.
Does it mean that each microservices-based architecture should use the BFF pattern? Not necessarily. The more complex design, the more setup and configuration it requires. Not every app may require that. But if you want to create an ecosystem of apps, or plan to extend it in the future, you may choose a more complex communication pattern for the sake of future scalability.
For eg,You may have microservices for Customers, Orders, Products, Shopping carts, etc. The microservices expose APIs to be used by the frontend.
However, the data returned to the frontend by the Microservices may not be formatted or filtered according to the exact way the frontend needs to represent them.In that case, the frontend needs to have some logic on its own to re-format these data. Having such logic in the frontend will use up more browser resources.
In a situation like this, we can use a BFF in order to shift some of this front-end logic to an intermediate layer. The intermediate layer is the BFF. When a frontend requests some data, it will call an API in the BFF.
The BFF will do the following.
As a result, there will be minimal logic on the frontend. Therefore, a BFF helps to streamline data representation and takes up the responsibility of providing a well-focused interface for the frontend.
Another great way to simplify your backend-frontend relation is by sharing types between them.
As we already explored, BFF acts as a simple interface between the frontend and microservices.
A single BFF is focused on a single UI, and that UI only. As a result, it will help us keep our frontends simple and see a unified view of data through its backend.
Now we know that a BFF is similar to a proxy server between the client and other external APIs, services, etc. If the request has to go through another component, it will definitely increase latency. However, the BFF latency is negligible compared to the browser’s high resource usage if it needs to work with multiple services not optimized for the frontend.
Building a BFF allows you to intelligently make batch calls to other backends/ microservices and return the data all at once, or return a more convenient representation by transforming and formatting the data.
This can be very useful for mobile clients on 2G or 3G networks where it can take seconds (or more) to establish the connection.
Like many other patterns, using the BFF in your application depends on the context and the architecture you plan to follow. For example, if your application is a simple monolithic app, a BFF is unnecessary. It will add little to no value.
However, if your application depends on microservices and consumes many external APIs and other services, it is better to use a BFF to streamline the data flow and introduce a lot of efficiency to your application.
Further, if your application needs to develop an optimized backend for a specific frontend interface or your clients need to consume data that require a significant amount of aggregation on the backend, BFF is a suitable option.
A few advantages of having a BFF are as follows:
Best practices to follow in practice
Conclusion
And so we conclude our exploration on the types of microservices based on communication patterns. We also explored on each type with the uses of the BFF pattern. With a simple design, we can empower a microservices ecosystem, allowing the interfaces to make a better use of the architecture. Not only that, but it could also make a useful tool to facilitate a migration between the old monolith application and the new world of microservices.
Presently we had a chance to restructure all the components in the Subscription and beyond subscriptions and resource groups.
Actually there are 4 ways to do so… one is via SQL, Azure Portal, Azure Powershell and Azure CLI.
I tried the first option, that was time consuming.
The second one is via SQL, the most reliable and easy apporach.
We need to login as admin login and run the below script in the destination server as admin
CREATE DATABASE destinationdb AS COPY OF [SourceServername].Sourcedb;
This will throw the error “Insufficient permission to create a database copy on server”.
To overcome this we need to add db manager role to the currently loged in user name
EXEC sp_addrolemember ‘dbmanager’, ‘theuserlogin’
and run the below query
CREATE DATABASE destinationdb AS COPY OF [SourceServername].Sourcedb (EDITION = ‘Standard’, SERVICE_OBJECTIVE = ‘S1’ );
And the db is copied from server to another in azure.
This will take completely 5-10 mins to do the entire process.
Happy learning!!!
Further details for other types are available in the below article
Anyone who worked on a big enterprise project knows memory leaks are very important. Too much of it, the impact will be deadly.
These techniques will teach you to detect when there’s a memory leak problem in the application, to find the specific memory leak..
Defining Memory Leaks in .NET
In a garbage collected environment, the term memory leaks is a bit counter intuitive. How can my memory leak when there’s garbage collector (GC) that takes care to collect everything?
There are 2 related core causes for this. The first core cause is when you have objects that are still referenced but are effectually unused. Since they are referenced, the garbage collector won’t collect them and they will remain forever, taking up memory. This can happen, for example, when you register to events but never unregister.
The second cause is when you somehow allocate unmanaged memory (without garbage collection) and don’t free it. This is not so hard to do. .NET itself has a lot of classes that allocate unmanaged memory. Almost anything that involves streams, graphics, the file system or network calls does that under the hood. Usually, these classes implement a Dispose method, which frees the memory (we’ll talk about that later). You can easily allocate unmanaged memory yourself with special .NET classes (like Marshal) or PInvoke (there’s an example of this further on).
Let’s move on to my best practice techniques list:
1. Detect a Memory Leak problem with the Diagnostic Tool Window
If you go to Debug | Windows | Show Diagnostic Tools, you’ll see this window. If you’re like me, you probably saw this tool window after installing Visual Studio, closed it immediately, and never thought of it again. The Diagnostic Tools Window can be quite useful though. It can easily help you detect 2 problems: Memory Leaks and GC Pressure.
When you have Memory Leaks, the Process Memory graph looks like this:

You can see with the yellow lines coming from the top that the GC is trying to free memory, but it still keeps rising.
When you have GC Pressure, the Process Memory graph looks like this:

GC Pressure is when you are creating new objects and disposing of them too quickly for the garbage collector to keep up. As you see in the picture, the memory is close to its limit and the GC bursts are very frequent.
You won’t be able to find specific memory leaks this way, but you can detect that you have a memory leak problem, which is useful by itself. In Enterprise Visual Studio, the Diagnostics Window also includes a built-in memory profiler, which does allow to find the specific leak. We’ll talk about memory profiling in best practice #3.
2. Detect Memory Leak problems with the Task Manager, Process Explorer or PerfMon
The second easiest way to detect major memory leak problems is with the Task Manager or Process Explorer (from SysInternals). These tools can show the amount of memory your process uses. If it consistently increases over time, you probably have a memory leak.

PerfMon is a bit harder to use but can show a nice graph of your memory usage over time. Here’s a graph of my application that endlessly allocates memory without freeing it. I’m using the Process | Private Bytes counter.

Note that this method is notoriously unreliable. You might have an increase in memory usage just because the GC didn’t collect it yet. There’s also the matter of shared memory and private memory, so you can both miss memory leaks and/or diagnose memory leaks that aren’t your own (explanation). Finally, you might mistake memory leaks for GC Pressure. In this case, you don’t have a memory leak but you create and dispose of objects so fast that the GC doesn’t keep up.
Despite the disadvantages, I mention this technique because it’s both easy to use and sometimes your only tool. It’s also a decent indicator something is wrong when observing for a very long period of time.
3. Use a memory profiler to detect memory leaks
A memory profiler is like the Chef’s Knife of handling memory leaks. It’s the main tool to find and fix them. While other techniques can be easier to use or cheaper (profiler licenses are costly), it’s best to be proficient by with at least one memory profiler to effectively solve memory leak problems.
The big names in .NET memory profilers are: dotMemory, SciTech Memory Profiler and ANTS Memory Profiler. There’s also a “free” profiler if you have Visual Studio Enterprise.
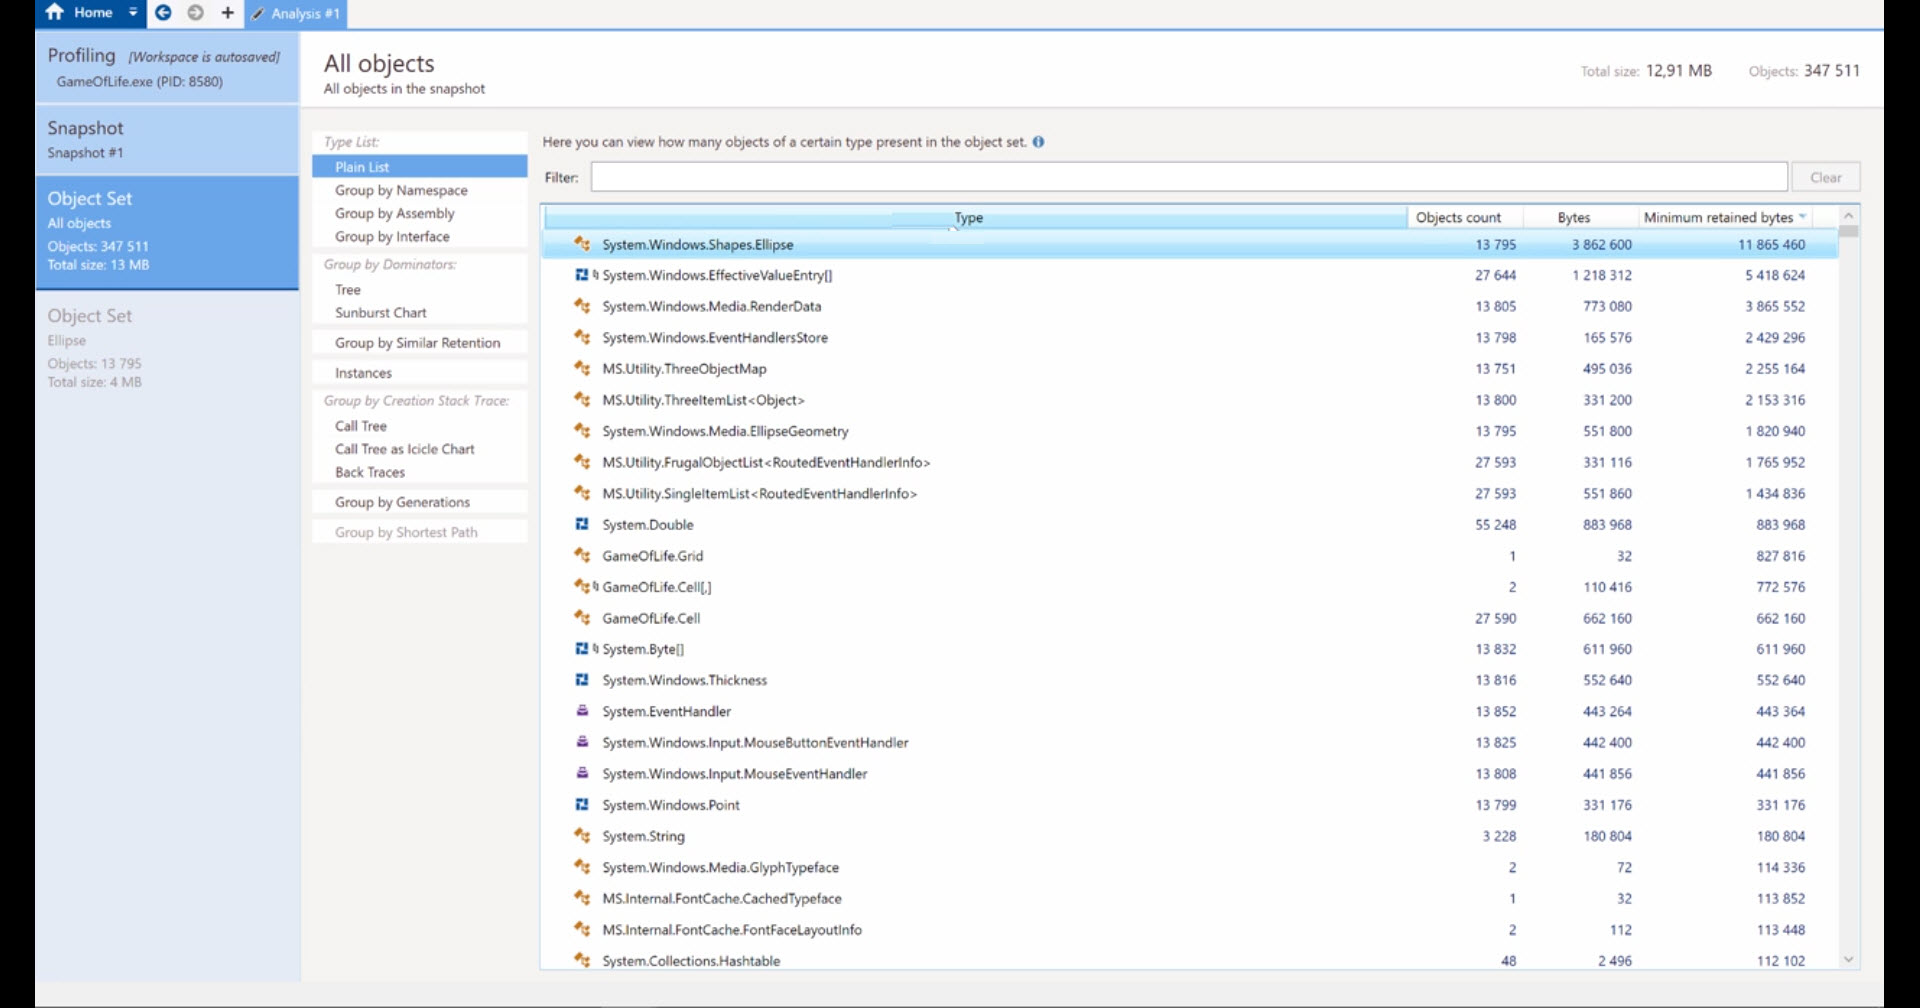
All memory profilers work in a similar way. You can either attach to a running process or open a Dump file. The profiler will create a Snapshot of your process’ current memory heap. You can analyze the snapshot in all kinds of ways For example, here’s a list of all the allocated objects in the current snapshot:

You can see how many instances of each type are allocated, how much memory they take, and the reference path to a GC Root.
A GC Root is an object which the GC can’t free, so anything that the GC root references also can’t be freed. Static objects and the local objects the current active Threads are GC Roots. Read more in Understanding Garbage Collection in .NET.
The quickest and most useful profiling technique is to compare 2 snapshots where the memory should return to the same state. The first snapshot is taken before an operation, and another snapshot is taken after the operation. The exact steps are:
Summary:
We understood how to analyse the Memory leakage.
Its Me Rama, Who is actually myself. I will speak more on the Technology :). I am from .NET background but also interested in various flavours of technology. You can expect my learnings here. And also can reach me for any Tech related support.
